About the CoMSES Model Library more info
Our mission is to help computational modelers at all levels engage in the establishment and adoption of community standards and good practices for developing and sharing computational models. Model authors can freely publish their model source code in the Computational Model Library alongside narrative documentation, open science metadata, and other emerging open science norms that facilitate software citation, reproducibility, interoperability, and reuse. Model authors can also request peer review of their computational models to receive a DOI.
All users of models published in the library must cite model authors when they use and benefit from their code.
Please check out our model publishing tutorial and contact us if you have any questions or concerns about publishing your model(s) in the Computational Model Library.
We also maintain a curated database of over 7500 publications of agent-based and individual based models with additional detailed metadata on availability of code and bibliometric information on the landscape of ABM/IBM publications that we welcome you to explore.
Displaying 10 of 67 results values clear
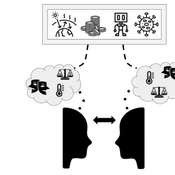
Peer reviewed Dynamic Value-based Cognitive Architectures
Bart de Bruin | Published Tuesday, November 30, 2021The intention of this model is to create an universal basis on how to model change in value prioritizations within social simulation. This model illustrates the designing of heterogeneous populations within agent-based social simulations by equipping agents with Dynamic Value-based Cognitive Architectures (DVCA-model). The DVCA-model uses the psychological theories on values by Schwartz (2012) and character traits by McCrae and Costa (2008) to create an unique trait- and value prioritization system for each individual. Furthermore, the DVCA-model simulates the impact of both social persuasion and life-events (e.g. information, experience) on the value systems of individuals by introducing the innovative concept of perception thermometers. Perception thermometers, controlled by the character traits, operate as buffers between the internal value prioritizations of agents and their external interactions. By introducing the concept of perception thermometers, the DVCA-model allows to study the dynamics of individual value prioritizations under a variety of internal and external perturbations over extensive time periods. Possible applications are the use of the DVCA-model within artificial sociality, opinion dynamics, social learning modelling, behavior selection algorithms and social-economic modelling.
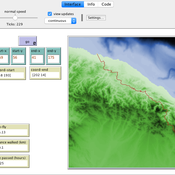
Peer reviewed Least cost path mobility
Claudine Gravel-Miguel Colin Wren | Published Saturday, September 02, 2017 | Last modified Monday, October 04, 2021This model aims to mimic human movement on a realistic topographical surface. The agent does not have a perfect knowledge of the whole surface, but rather evaluates the best path locally, at each step, thus mimicking imperfect human behavior.
Peer reviewed JuSt-Social COVID-19
Jennifer Badham | Published Thursday, June 18, 2020 | Last modified Monday, March 29, 2021NetLogo model that allows scenarios concerning general social distancing, shielding of high-risk individuals, and informing contacts when symptomatic. Documentation includes a user manual with some simple scenarios, and technical information including descriptions of key procedures and parameter values.
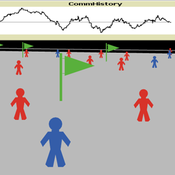
This model presents an autonomous, two-lane driving environment with a single lane-closure that can be toggled. The four driving scenarios - two baseline cases (based on the real-world) and two experimental setups - are as follows:
- Baseline-1 is where cars are not informed of the lane closure.
- Baseline-2 is where a Red Zone is marked wherein cars are informed of the lane closure ahead.
- Strategy-1 is where cars use a co-operative driving strategy - FAS. <sup>[1]</sup>
- Strategy-2 is a variant of Strategy-1 and uses comfortable deceleration values instead of the vehicle’s limit.
…
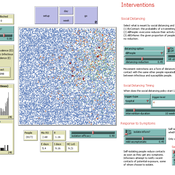
AIforGoodSimulator - Modeling Covid-19 Spread and Potential Interventions in Refugee Camps
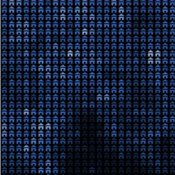
Shyaam Ramkumar Woi Sok Oh | Published Thursday, March 18, 2021The Netlogo model is a conceptualization of the Moria refugee camp, capturing the household demographics of refugees in the camp, a theoretical friendship network based on values, and an abstraction of their daily activities. The model then simulates how Covid-19 could spread through the camp if one refugee is exposed to the virus, utilizing transmission probabilities and the stages of disease progression of Covid-19 from susceptible to exposed to asymptomatic / symptomatic to mild / severe to recovered from literature. The model also incorporates various interventions - PPE, lockdown, isolation of symptomatic refugees - to analyze how they could mitigate the spread of the virus through the camp.
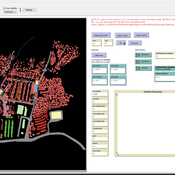
Human Environment Estuarine Systems Investigator
Andrew Allison | Published Friday, February 26, 2021This model simulates the form and function of an idealised estuary with associated barrier-spit complex on the north east coast of New Zealand’s North Island (from Bream Bay to central Bay of Plenty) during the years 2010 - 2050 CE. It combines variables from social, ecological and geomorphic systems to simulate potential directions of change in shallow coastal systems in response to external forcing from land use, climate, pollution, population density, demographics, values and beliefs. The estuary is over 1000Ha, making it a large estuary according to Hume et al. (2007) - there are 12 large estuaries in the Auckland region alone (Suyadi et al., 2019). The model was developed as part of Andrew Allison’s PhD Thesis in Geography from the School of Environment and Institute of Marine Science, University of Auckland, New Zealand. The model setup allows for alteration of geomorphic, ecological and social variables to suit the specific conditions found in various estuaries along the north east coast of New Zealand’s North Island.
This model is not a predictive or forecasting model. It is designed to investigate potential directions of change in complex shallow coastal systems. This model must not be used for any purpose other than as a heuristic to facilitate researcher and stakeholder learning and for developing system understanding (as per Allison et al., 2018).
Model of communication between two groups of managers in the course of project implementation
Smarzhevskiy Ivan | Published Monday, December 07, 2020This is a simulation model of communication between two groups of managers in the course of project implementation. The “world” of the model is a space of interaction between project participants, each of which belongs either to a group of work performers or to a group of customers. Information about the progress of the project is publicly available and represents the deviation Earned value (EV) from the planned project value (cost baseline).
The key elements of the model are 1) persons belonging to a group of customers or performers, 2) agents that are communication acts. The life cycle of persons is equal to the time of the simulation experiment, the life cycle of the communication act is 3 periods of model time (for the convenience of visualizing behavior during the experiment). The communication act occurs at a specific point in the model space, the coordinates of which are realized as random variables. During the experiment, persons randomly move in the model space. The communication act involves persons belonging to a group of customers and a group of performers, remote from the place of the communication act at a distance not exceeding the value of the communication radius (MaxCommRadius), while at least one representative from each of the groups must participate in the communication act. If none are found, the communication act is not carried out. The number of potential communication acts per unit of model time is a parameter of the model (CommPerTick).
The managerial sense of the feedback is the stimulating effect of the positive value of the accumulated communication complexity (positive background of the project implementation) on the productivity of the performers. Provided there is favorable communication (“trust”, “mutual understanding”) between the customer and the contractor, it is more likely that project operations will be performed with less lag behind the plan or ahead of it.
The behavior of agents in the world of the model (change of coordinates, visualization of agents’ belonging to a specific communicative act at a given time, etc.) is not informative. Content data are obtained in the form of time series of accumulated communicative complexity, the deviation of the earned value from the planned value, average indicators characterizing communication - the total number of communicative acts and the average number of their participants, etc. These data are displayed on graphs during the simulation experiment.
The control elements of the model allow seven independent values to be varied, which, even with a minimum number of varied values (three: minimum, maximum, optimum), gives 3^7 = 2187 different variants of initial conditions. In this case, the statistical processing of the results requires repeated calculation of the model indicators for each grid node. Thus, the set of varied parameters and the range of their variation is determined by the logic of a particular study and represents a significant narrowing of the full set of initial conditions for which the model allows simulation experiments.
…
This model investigates how anti-conformist intentions could be related to some biases on the perception of attitudes. It starts from two case studies, related to the adoption of organic farming, that show anti-conformist intentions. It proposes an agent-based model which computes an intention based on the Theory of Reasoned Action and assumes some biases in the perception of others’ attitudes according to the Social Judgement Theory.
It investigates the conditions on the model parameter values for which the simulations reproduce the features observed in the case studies. The results suggest that perception biases are indeed likely to contribute to anti-conformist intentions.
Peer reviewed Neighbor Influenced Energy Retrofit (NIER) agent-based model
Eric Boria | Published Friday, April 03, 2020The NIER model is intended to add qualitative variables of building owner types and peer group scales to existing energy efficiency retrofit adoption models. The model was developed through a combined methodology with qualitative research, which included interviews with key stakeholders in Cleveland, Ohio and Detroit and Grand Rapids, Michigan. The concepts that the NIER model adds to traditional economic feasibility studies of energy retrofit decision-making are differences in building owner types (reflecting strategies for managing buildings) and peer group scale (neighborhoods of various sizes and large-scale Districts). Insights from the NIER model include: large peer group comparisons can quickly raise the average energy efficiency values of Leader and Conformist building owner types, but leave Stigma-avoider owner types as unmotivated to retrofit; policy interventions such as upgrading buildings to energy-related codes at the point of sale can motivate retrofits among the lowest efficient buildings, which are predominantly represented by the Stigma-avoider type of owner; small neighborhood peer groups can successfully amplify normal retrofit incentives.
An Agent-based Model of Firm Size Distribution and Collaborative Innovation
Inyoung Hwang | Published Monday, December 09, 2019I added a discounting rate to the equation for expected values of defective / collaborative strategies.
The discounting rate was set to 0.956, the annual average from 1980 to 2015, using the Consumer Price Index (CPI) of Statistics Korea.
Displaying 10 of 67 results values clear