About the CoMSES Model Library more info
Our mission is to help computational modelers at all levels engage in the establishment and adoption of community standards and good practices for developing and sharing computational models. Model authors can freely publish their model source code in the Computational Model Library alongside narrative documentation, open science metadata, and other emerging open science norms that facilitate software citation, reproducibility, interoperability, and reuse. Model authors can also request peer review of their computational models to receive a DOI.
All users of models published in the library must cite model authors when they use and benefit from their code.
Please check out our model publishing tutorial and contact us if you have any questions or concerns about publishing your model(s) in the Computational Model Library.
We also maintain a curated database of over 7500 publications of agent-based and individual based models with additional detailed metadata on availability of code and bibliometric information on the landscape of ABM/IBM publications that we welcome you to explore.
Displaying 10 of 103 results market clear
Auctionsimulation
Deniz Kayar | Published Wednesday, August 12, 2020This repository the multi-agent simulation software for the paper “Comparison of Competing Market Mechanisms with Reinforcement Learning in a CarPooling Scenario”. It’s a mutlithreaded Javaapplication.
Peer reviewed BAM: The Bottom-up Adaptive Macroeconomics Model
Alejandro Platas López Alejandro Guerra-Hernández | Published Tuesday, January 14, 2020 | Last modified Sunday, July 26, 2020Overview
Purpose
Modeling an economy with stable macro signals, that works as a benchmark for studying the effects of the agent activities, e.g. extortion, at the service of the elaboration of public policies..
…
Behavioural parallel trading systems
Marcin Czupryna | Published Friday, June 26, 2020This model simulates the behaviour of the agents in 3 wine markets parallel trading systems: Liv-ex, Auctions and additionally OTC market (finally not used). Behavioural aspects (impatience) is additionally modeled. This is an extention of parallel trading systems model with technical trading (momentum and contrarian) and noise trading.
Parallel trading systems
Marcin Czupryna | Published Friday, June 26, 2020The model simulates agents behaviour in wine market parallel trading systems: auctions, OTC and Liv-ex. Models are written in JAVA and use MASON framework. To run a simulation download source files with additional src folder with sobol.csv file. In WineSimulation.java set RESULTS_FOLDER parameter. Uses following external libraries mason19..jar, opencsv.jar, commons-lang3-3.5.jar and commons-math3-3.6.1.jar.
Emission Trading Impact On Power Generation Model
Emile Chappin | Published Friday, June 19, 2020Under the Kyoto Protocol, governments agreed on and accepted CO2 reduction targets in order to counter climate change. In Europe one of the main policy instruments to meet the agreed reduction targets is CO2 emission-trading (CET), which was implemented as of January 2005. In this system, companies active in specific sectors must be in the possession of CO2 emission rights to an amount equal to their CO2 emission. In Europe, electricity generation accounts for one-third of CO2 emissions. Since the power generation sector, has been liberalized, reregulated and privatized in the last decade, around Europe autonomous companies determine the sectors’ CO2 emission. Short-term they adjust their operation, long-term they decide on (dis)investment in power generation facilities and technology selection. An agent-based model is presented to elucidate the effect of CET on the decisions of power companies in an oligopolistic market. Simulations over an extensive scenario-space show that there CET does have an impact. A long-term portfolio shift towards less-CO2 intensive power generation is observed. However, the effect of CET is relatively small and materializes late. The absolute emissions from power generation rise under most scenarios. This corresponds to the dominant character of current capacity expansion planned in the Netherlands (50%) and in Germany (68%), where companies have announced many new coal based power plants. Coal is the most CO2 intensive option available and it seems surprising that even after the introduction of CET these capacity expansion plans indicate a preference for coal. Apparently in power generation the economic effect of CO2 emission-trading is not sufficient to outweigh the economic incentives to choose for coal.
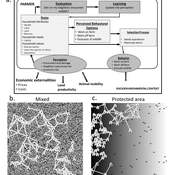
Wildlife-Human Interactions in Shared Landscapes (WHISL)
Andres Baeza-Castro Neil Carter Nicholas Magliocca | Published Friday, May 22, 2020This model simulates a group of farmers that have encounters with individuals of a wildlife population. Each farmer owns a set of cells that represent their farm. Each farmer must decide what cells inside their farm will be used to produce an agricultural good that is self in an external market at a given price. The farmer must decide to protect the farm from potential encounters with individuals of the wildlife population. This decision in the model is called “fencing”. Each time that a cell is fenced, the chances of a wildlife individual to move to that cell is reduced. Each encounter reduces the productive outcome obtained of the affected cell. Farmers, therefore, can reduce the risk of encounters by exclusion. The decision of excluding wildlife is made considering the perception of risk of encounters. In the model, the perception of risk is subjective, as it depends on past encounters and on the perception of risk from other farmers in the community. The community of farmers passes information about this risk perception through a social network. The user (observer) of the model can control the importance of the social network on the individual perception of risk.
Peer reviewed General Housing Model
J Applegate | Published Thursday, May 07, 2020The General Housing Model demonstrates a basic housing market with bank lending, renters, owners and landlords. This model was developed as a base to which students contributed additional functions during Arizona State University’s 2020 Winter School: Agent-Based Modeling of Social-Ecological Systems.
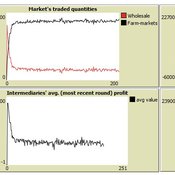
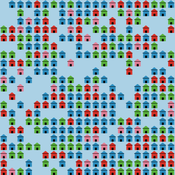
Market-level effects of firm-level adaptation and intermediation in networked markets of fresh foods: a case study in Colombia.
Cesar Garcia-Diaz | Published Sunday, April 12, 2020 | Last modified Sunday, April 12, 2020This a model developed as a part of the paper Mejía, G. & García-Díaz, C. (2018). Market-level effects of firm-level adaptation and intermediation in networked markets of fresh foods: a case study in Colombia. Agricultural Systems 160: 132-142.
It simulates the competition dynamics of the potato market in Bogotá, Colombia. The model explores the economic impact of intermediary actors on the potato supply chain.
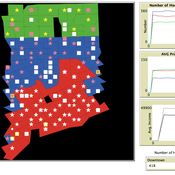
Exploring Urban Shrinkage
Andrew Crooks | Published Thursday, March 19, 2020While the world’s total urban population continues to grow, this growth is not equal. Some cities are declining, resulting in urban shrinkage which is now a global phenomenon. Many problems emerge due to urban shrinkage including population loss, economic depression, vacant properties and the contraction of housing markets. To explore this issue, this paper presents an agent-based model stylized on spatially explicit data of Detroit Tri-county area, an area witnessing urban shrinkage. Specifically, the model examines how micro-level housing trades impact urban shrinkage by capturing interactions between sellers and buyers within different sub-housing markets. The stylized model results highlight not only how we can simulate housing transactions but the aggregate market conditions relating to urban shrinkage (i.e., the contraction of housing markets). To this end, the paper demonstrates the potential of simulation to explore urban shrinkage and potentially offers a means to test polices to alleviate this issue.
A Bottom-Up Simulation on Competition and Displacement of Online Interpersonal Communication Platforms
great-sage-futao | Published Tuesday, December 31, 2019 | Last modified Tuesday, December 31, 2019This model aims to simulate Competition and Displacement of Online Interpersonal Communication Platforms process from a bottom-up angle. Individual interpersonal communication platform adoption and abandonment serve as the micro-foundation of the simulation model. The evolution mode of platform user online communication network determines how present platform users adjust their communication relationships as well as how new users join that network. This evolution mode together with innovations proposed by individual interpersonal communication platforms would also have impacts on the platform competition and displacement process and result by influencing individual platform adoption and abandonment behaviors. Three scenes were designed to simulate some common competition situations occurred in the past and current time, that two homogeneous interpersonal communication platforms competed with each other when this kind of platforms first came into the public eye, that a late entrant platform with a major innovation competed with the leading incumbent platform during the following days, as well as that both the leading incumbent and the late entrant continued to propose many small innovations to compete in recent days, respectively.
Initial parameters are as follows: n(Nmax in the paper), denotes the final node number of the online communication network node. mi (m in the paper), denotes the initial degree of those initial network nodes and new added nodes. pc(Pc in the paper), denotes the proportion of links to be removed and added in each epoch. pst(Pv in the paper), denotes the proportion of nodes with a viscosity to some platforms. comeintime(Ti in the paper), denotes the epoch when Platform 2 joins the market. pit(Pi in the paper), denotes the proportion of nodes adopting Platform 2 immediately at epoch comeintime(Ti). ct(Ct in the paper), denotes the Innovation Effective Period length. In Scene 2, There is only one major platform proposed by Platform 2, and ct describes that length. However, in Scene 3, Platform 2 and 1 will propose innovations alternately. And so, we set ct=10000 in simulation program, and every jtt epochs, we alter the innovation proposer from one platform to the other. Hence in this scene, jtt actually denotes the Innovation Effective Period length instead of ct.
Displaying 10 of 103 results market clear